Business intelligence (BI) is an umbrella term for technology. Theoretically, the use of high class software or business applications of the use of values to make better decisions for the company,...
Business intelligence (BI) is an umbrella term for technology. Theoretically, the use of high class software or business applications of the use of values to make better decisions for the company, Technical and Practical business Intelligence are tools for collecting, processing, and analyzing data. This way the company can evaluate the results and interpret them.
BI systems enable effective risk management, advancing a company’s position within the marketplace, enabling decision-makers to recognize performance gaps, market trends, or new revenue opportunities more quickly.
SQL (structure Query Language) prepares data to make it ready to consumption in the business intelligence world. So understanding traditional SQL is essential before investigating into business intelligence(BI). SQL still remains an essential tool in the hands of data engineers and business intelligence.
Businesses without a data warehouse were messy and unstructured data, from which end users on the business side of the organization struggled to get anything useful out of it. A data warehouse takes all that scattered data and lays it out nice and tidy in a huge relational database, through a process of Extract-Transform-Load (ETL).
This data warehouse practice involves transforming data that is optimized for a heavily transactional system and moving it to one that is more suited for analytic querying.
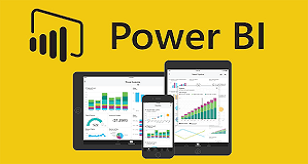
Power BI one of the best and secure business intelligence software tools. Power BI transforms your company’s data into rich visuals for you to collect and organize so you can focus on what matters to you. Stay in the know, spot trends as they happen, and push your business further.
With Power BI Service, setup automatic data refresh so everyone has the latest information. You can access your data and reports from anywhere with the power BI Mobile apps, which update automatically with any changes to your data.
You will never miss a lecture at Dean Institute ! You can choose either of the two options:
View the recorded session of the class available in your LMS.
You can attend the missed session, in any other live batch.
Enroll now to attend the never miss and one of the best Power BI course class offered by dian-instritute.
Your access to the Support Team is for a lifetime and will be available 24/7. The team will help you in resolving queries, during, and after the Power BI certification course.
Post-enrolment, the LMS access will be instantly provided to you and will be available for a lifetime. You will be able to access the complete set of previous class recordings, PPTs, PDFs, assignments. Moreover, access to our 24x7 support team will be granted instantly as well. You can start learning right away.
Yes, access to the course material will be available for a lifetime once you have enrolled in the course. So what are you waiting for then? Get enroll with industries one of the best Power Bi course offered by Dean Institute.
Power BI is a Microsoft business intelligence tool for business analytics. This tool allows users to aggregate and share data with reports, visualizations, and other analytics tools. It helps you create reports and charts for business insights. Power BI is available in Windows desktop app, online cloud-based software as a service, a report builder, a report server, a visual marketplace, and mobile apps for Windows, iOS, and Android tablets and smartphones.


Enrolled

Hours Required
Hours
0 video
Quizzes
Certificate
| Sep 04th | Sat & Sun (6 Weeks) | Time-09:00 PM to 12:00 AM |
| Sep 14th | Sat & Sun | Time-09:00 PM to 11:00 PM |
| Oct 27th | Sat & Sun (5 Weeks) | Time-09:00 PM to 11:00 PM |

